| Aqsa Nabi
Dashboards have always been an easy way out to monitor data. Even mobile phones have this feature to represent phone efficiency, power, and different type of information relevant to user experience. Big-scale businesses have been using dashboard and charts from long time ago, to manage real-time updates in a more organized way.
Like always, Microsoft has made data management easier with dynamic dashboards in Power Platform solution. Although, Power BI is way more promising when it comes to reporting and in-dept data analysis but with Dynamics dashboard, even a non-developer can get hands on and create interactive charts with a few simple steps.
How Dynamics Dashboard work?
If you have a Model-driven app set-up with data in solution, you can create charts and compile them in a dashboard view.
Get the correct privileges assigned to your user as there are two types of users who can create dashboards with two types.
- App User: Creates custom dashboard visible to only the user.
- Admin or Customizer: Creates custom dashboard visible to all users across the application. A user can also set their user dashboard as default dashboard.
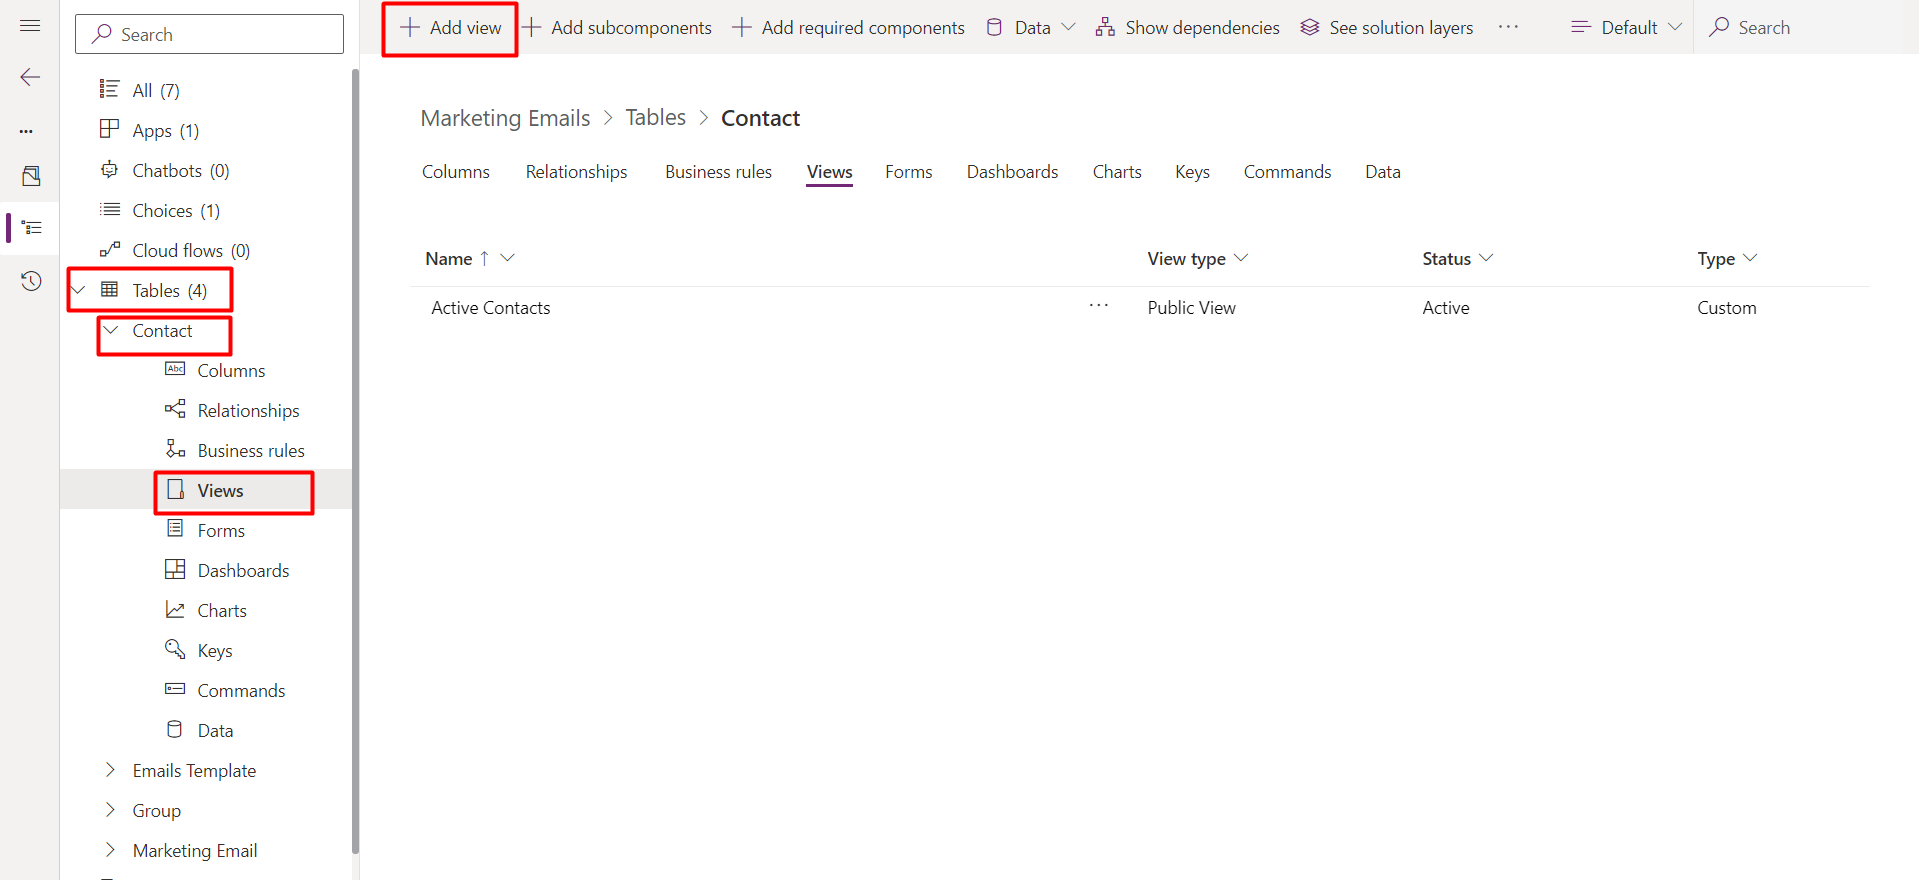
Go in solutions > Click the solution you want to make charts for (it must have the desired data residing in it). Select a table and navigate to Views.

Create a new view. Give unique name to the view, choose desired columns where you can also get filtered data to create the view.

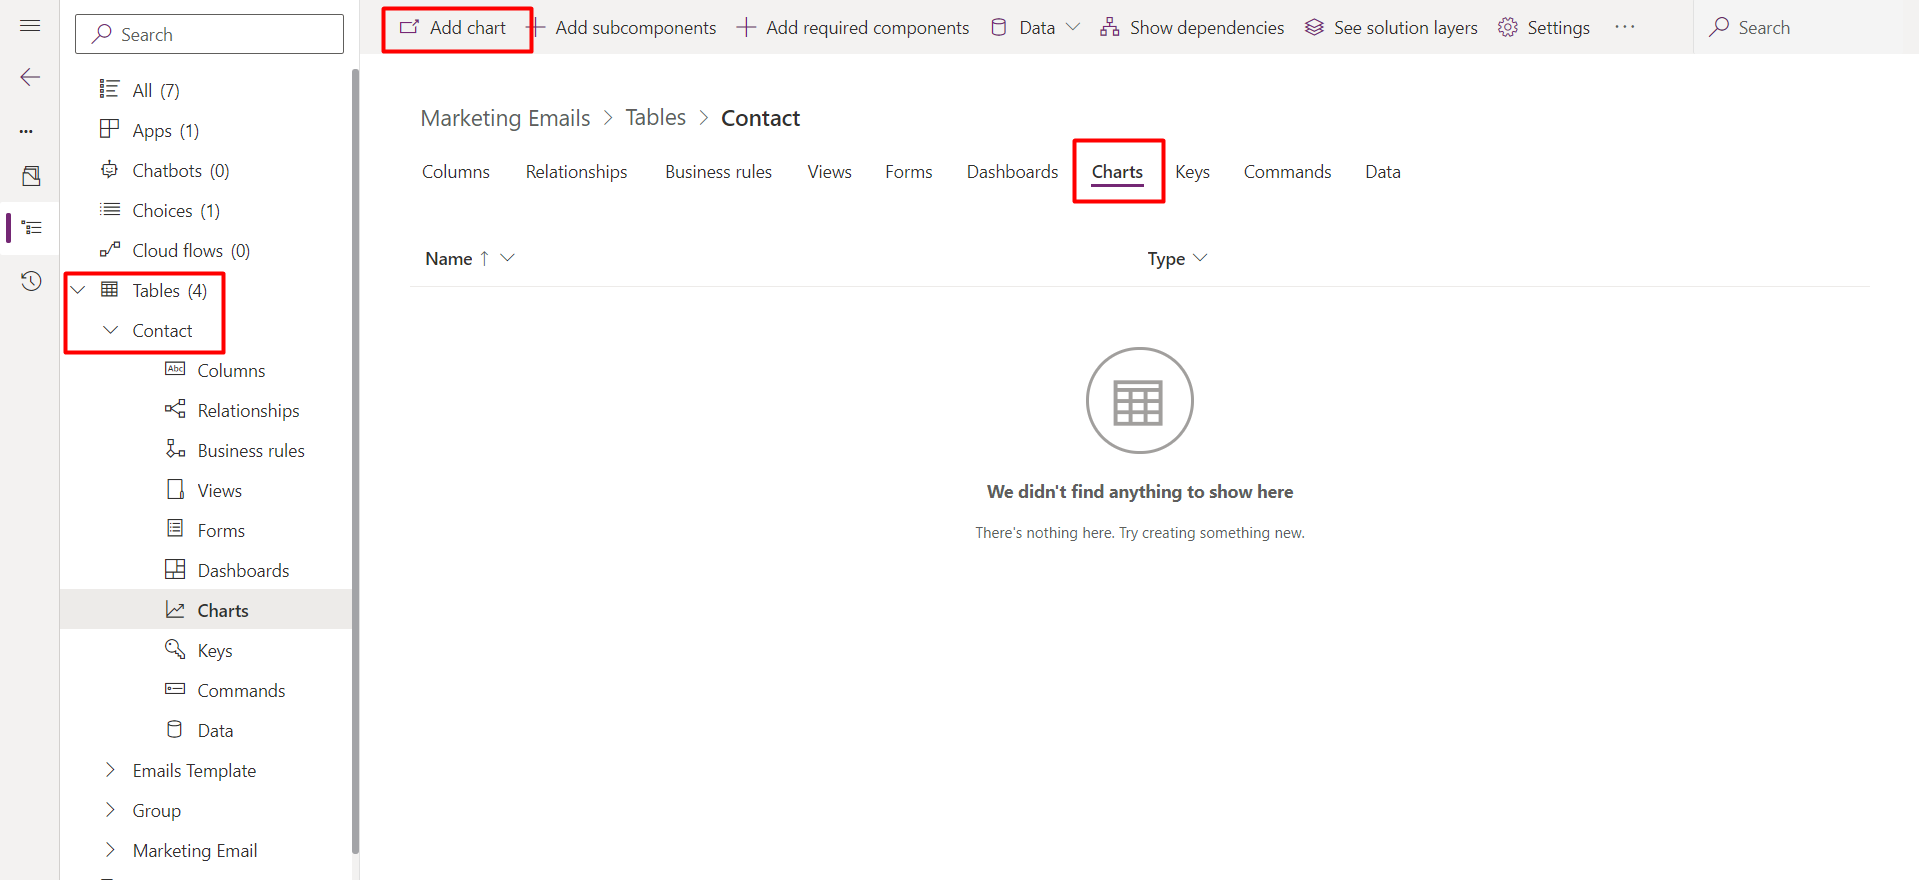
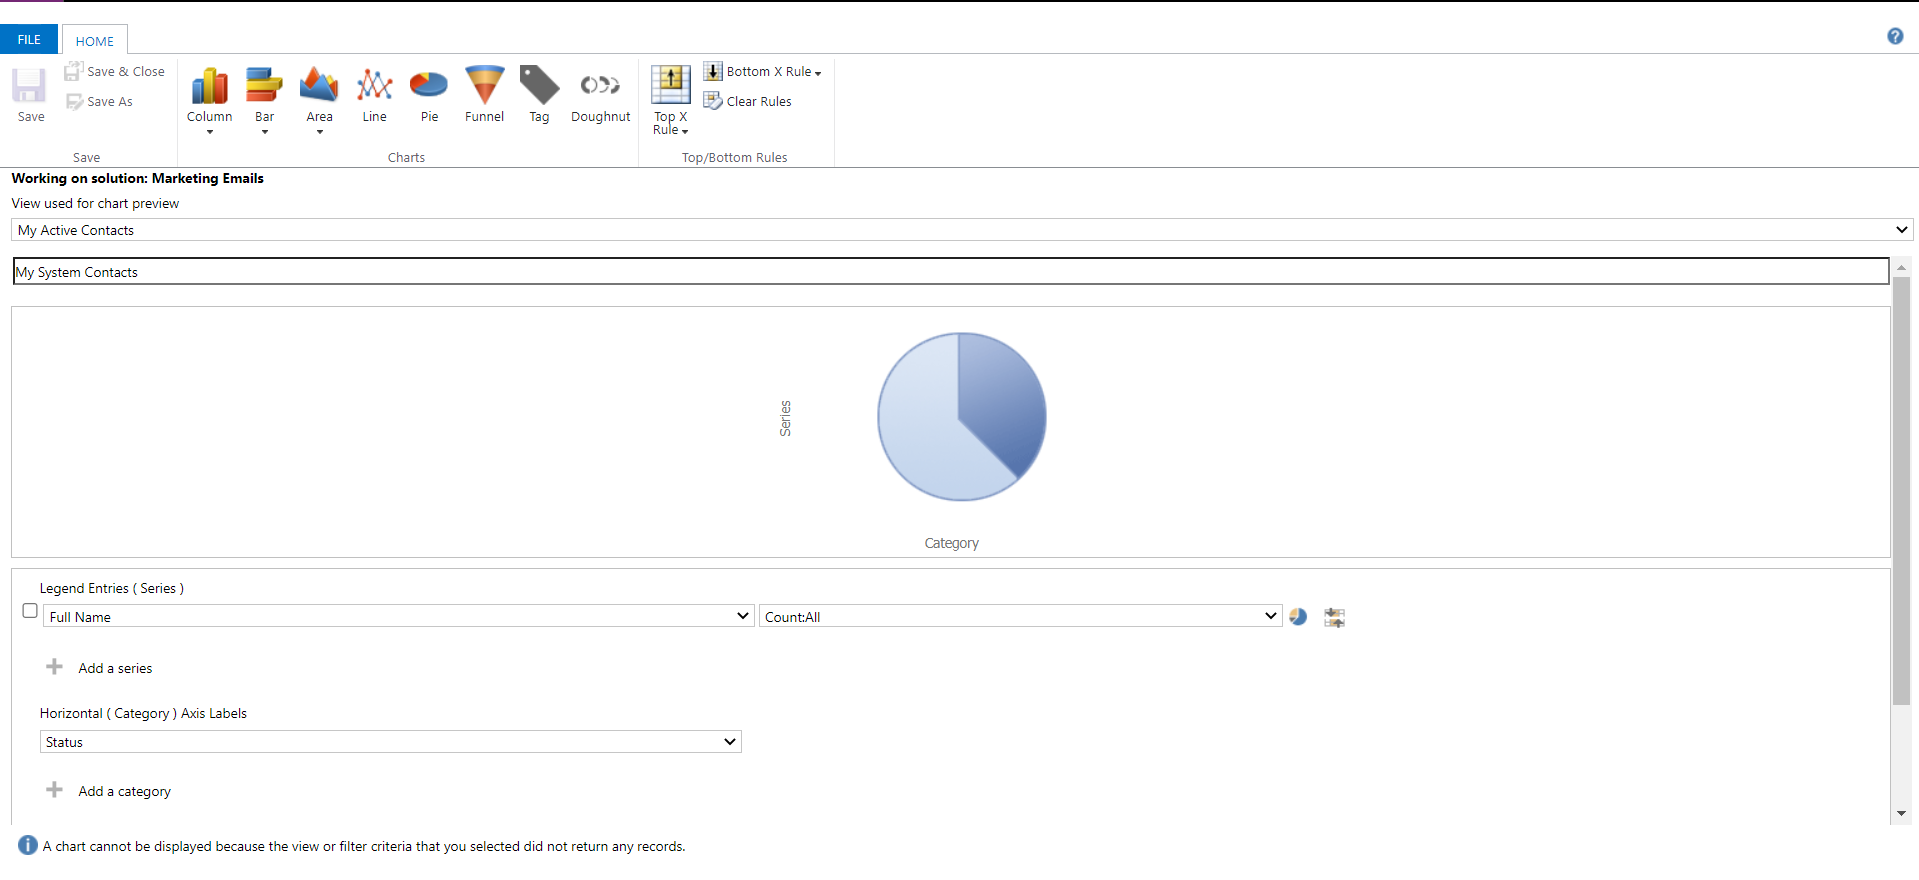
Save and publish the view. Navigate to the Charts tab and add a new chart. Here, gives a name to the chart, select the view you just published and pick the type of chart you wish to display data.

Select valid columns for the chart view, the system shows a preview of the chart. Save and publish the chart.

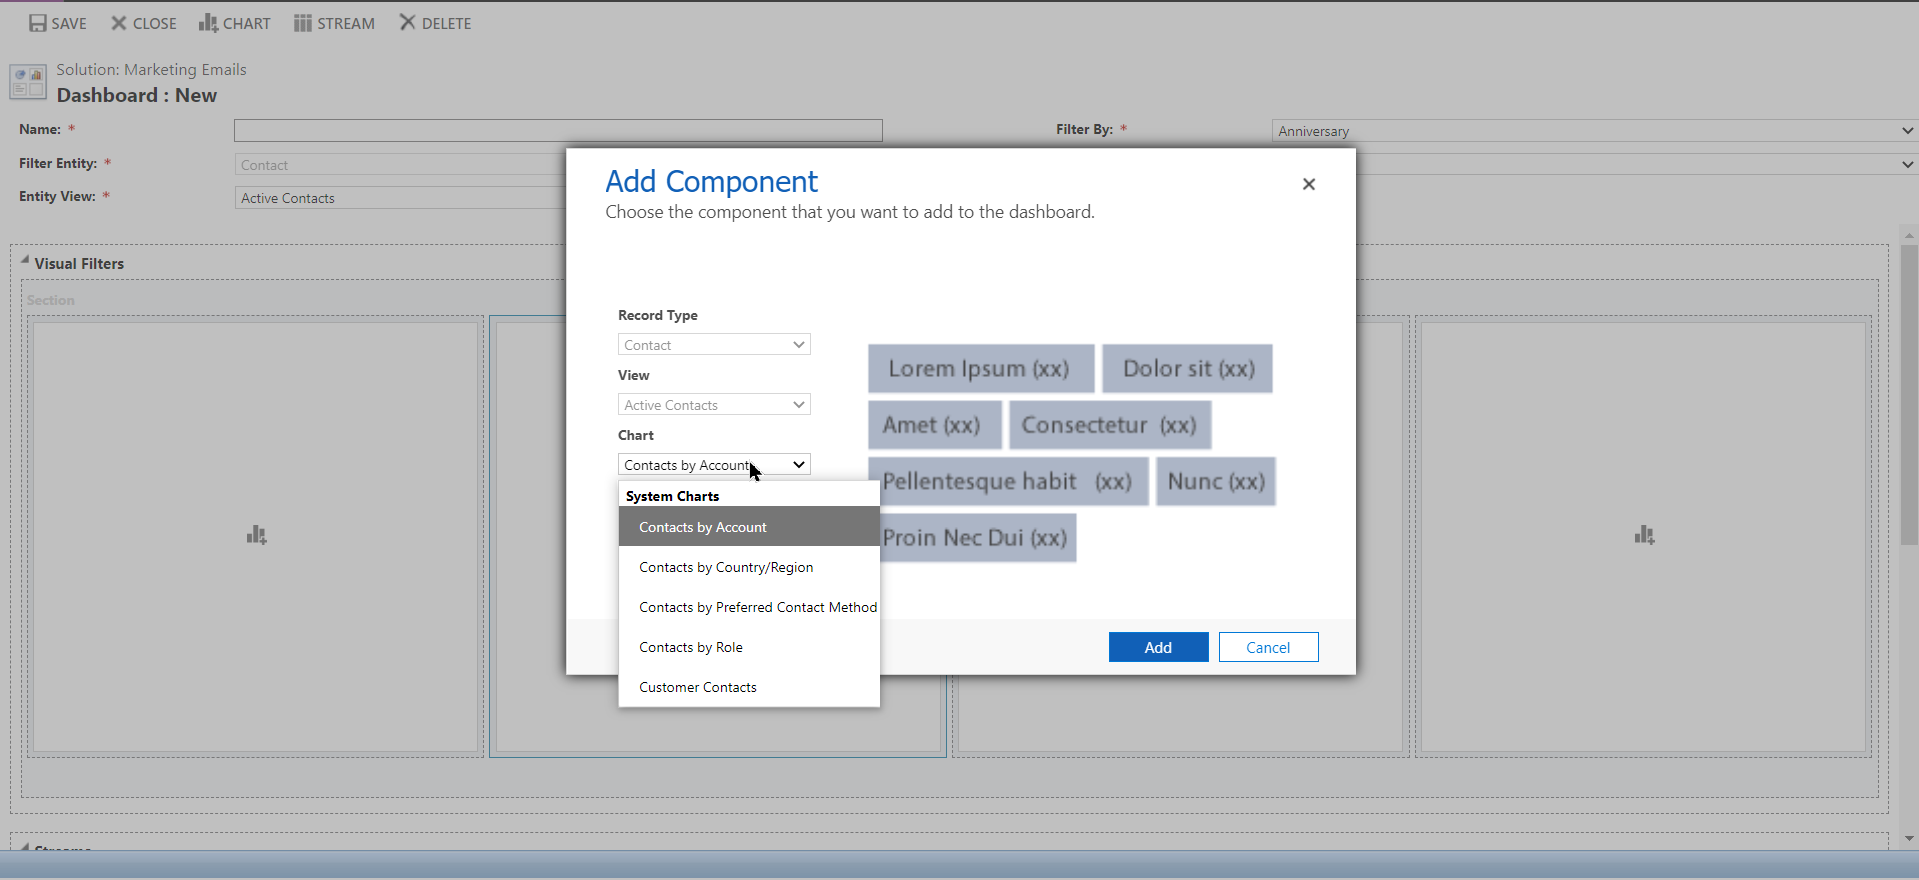
Now move to the Dashboard tab, click New, select the column view from given options provide a name to the dashboard which will be displayed on the Model-driven side as well. A new window opens where you can click on Charts and pick the newly created chart. Adjust the size and width of chart from option available in command bar. Click save and publish.

Refresh Model-driven app a few times and apply filter view to the dashboard!
Join us next time, as we continue our journey of learning canvas apps.Click here to learn more about Imperium's Power Apps Services. We hope this information was useful, and we look forward to sharing more insights into the Power Platform world.

